I don't come from the most traditional background
for a sports journalist.
I'm a chemical engineer and computer scientist by education, but much to the detriment of my future earning potential, I caught the sports bug during my first year of college and was fortunate to receive the opportunity to pursue a full-time sportswriting career at MLB.com, where I currently cover the Minnesota Twins as the team beat reporter.
Since starting my career at The Stanford Daily, I've had the privilege to cover two Rose Bowls, the USMNT, a no-hitter by Sean Manaea of the Oakland Athletics and, most recently, the Twins' first AL Central title and appearance in the ALDS since 2010.
But that's not to say I've left my quantitative roots behind. As data analytics and visualizations become more widely accepted and integrated into mainstream sports thinking, I hope to leverage my engineering background and reporting experience to not only understand and process data, but also communicate it to fans and readers.
2019 Minnesota Twins

Top Moments
The 2019 Twins were projected by most to finish second to the Cleveland Indians in the American League Central. Spurred by breakout years from much of their young core, they instead finished with 101 wins and their first division title since 2010.
Postseason Content
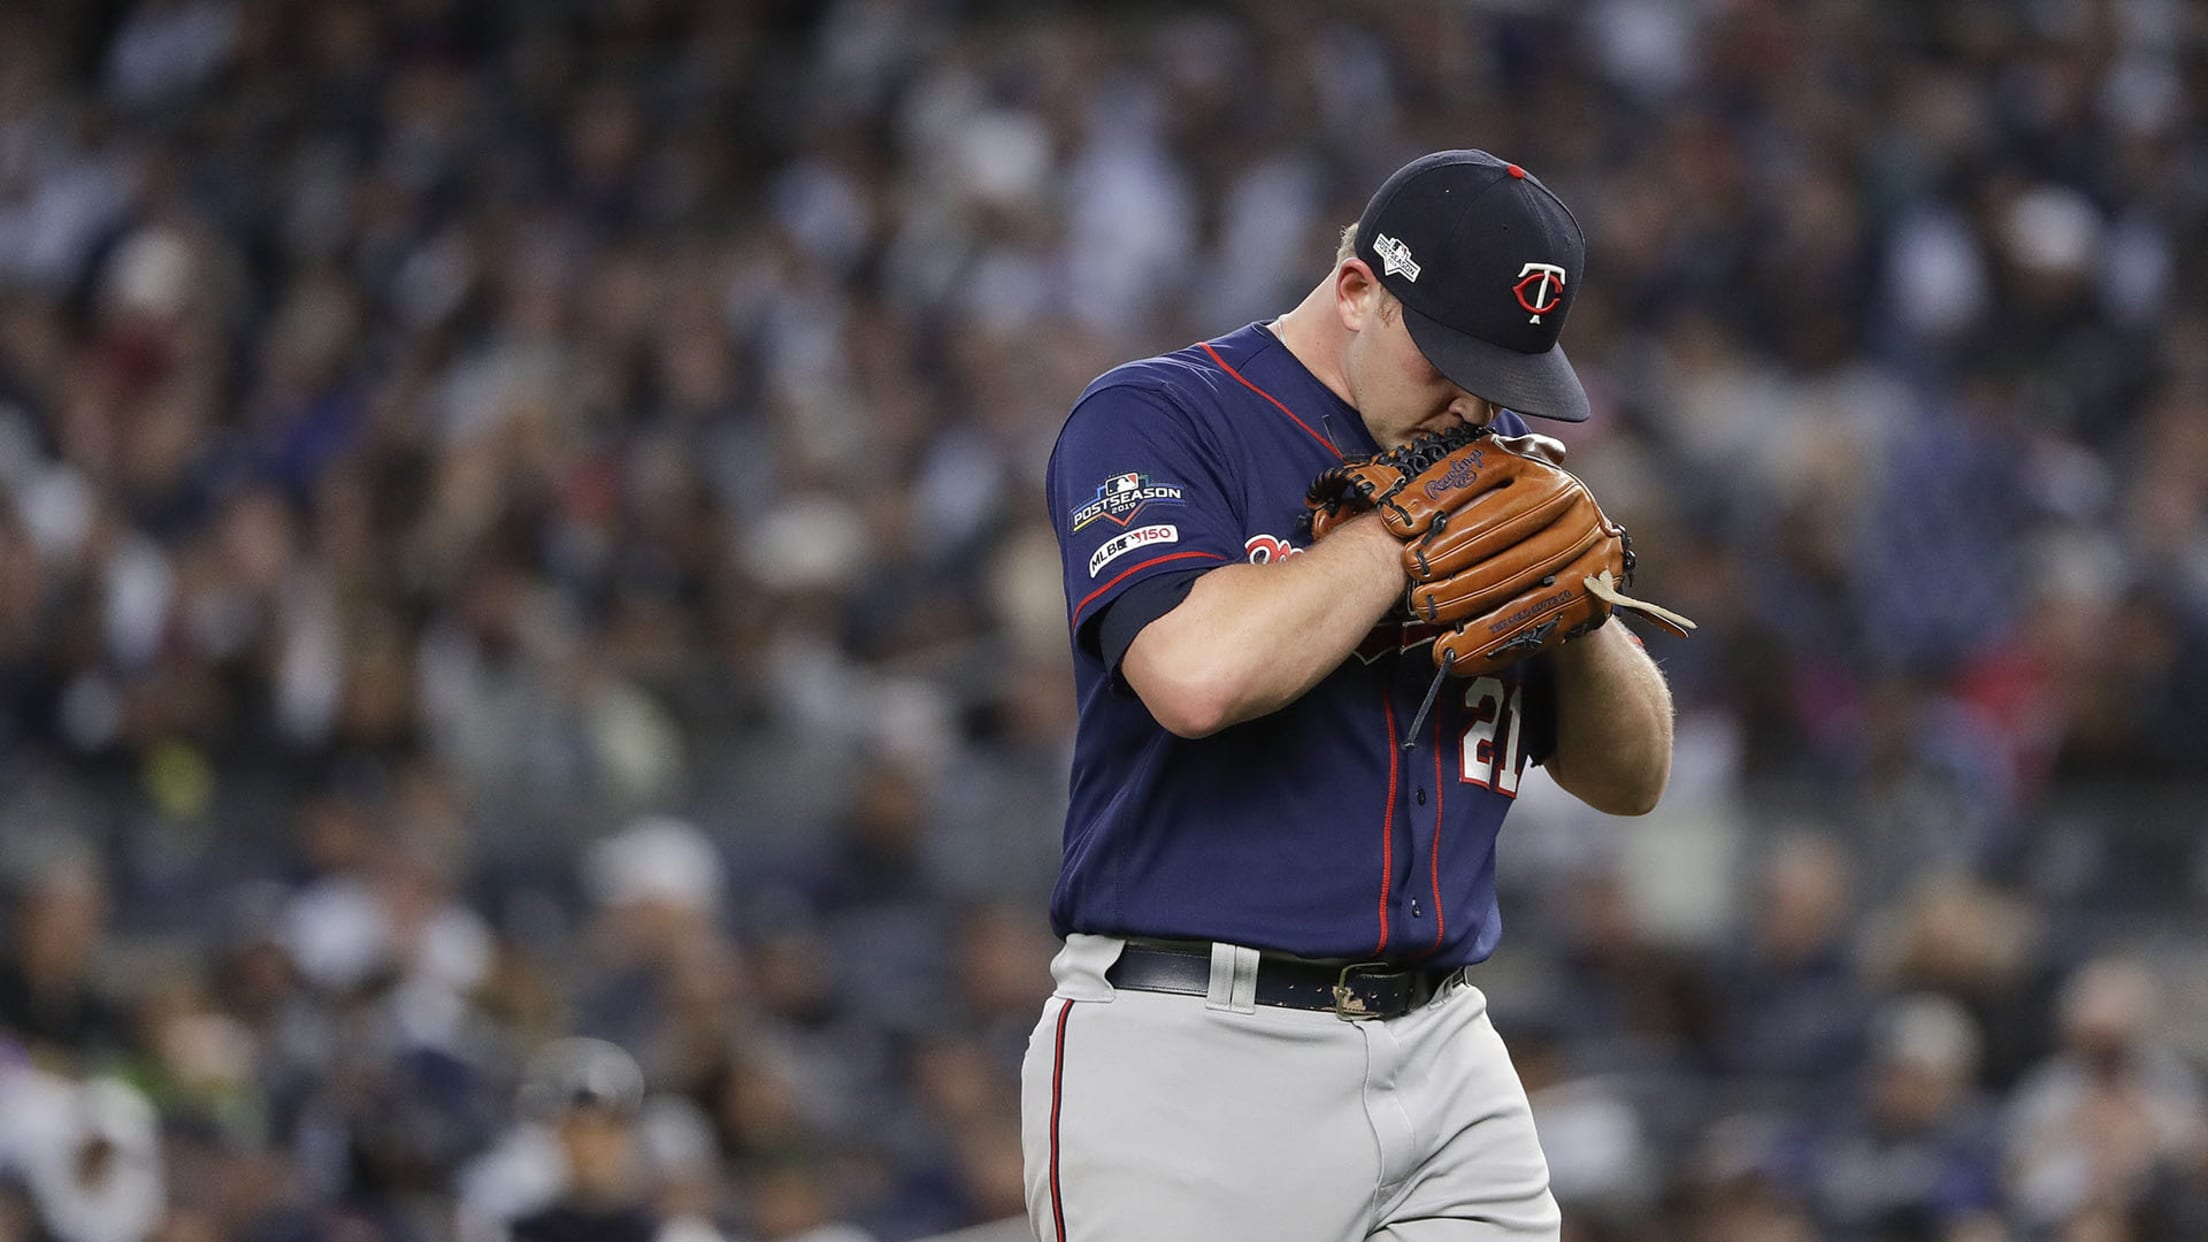
The Twins drew a first-round matchup against the New York Yankees in the American League Division Series and were swept out of the postseason. Their 16-game playoff losing streak matches the longest in the history of American "Big Four" sports.
Mailbags
Longtime fans of the Twins (and really, those that have paid close attention) know that Monday off-days are generally the time for the Twins Mailbag at MLB.com. Questions can be submitted on Twitter or via email.

Season in Review
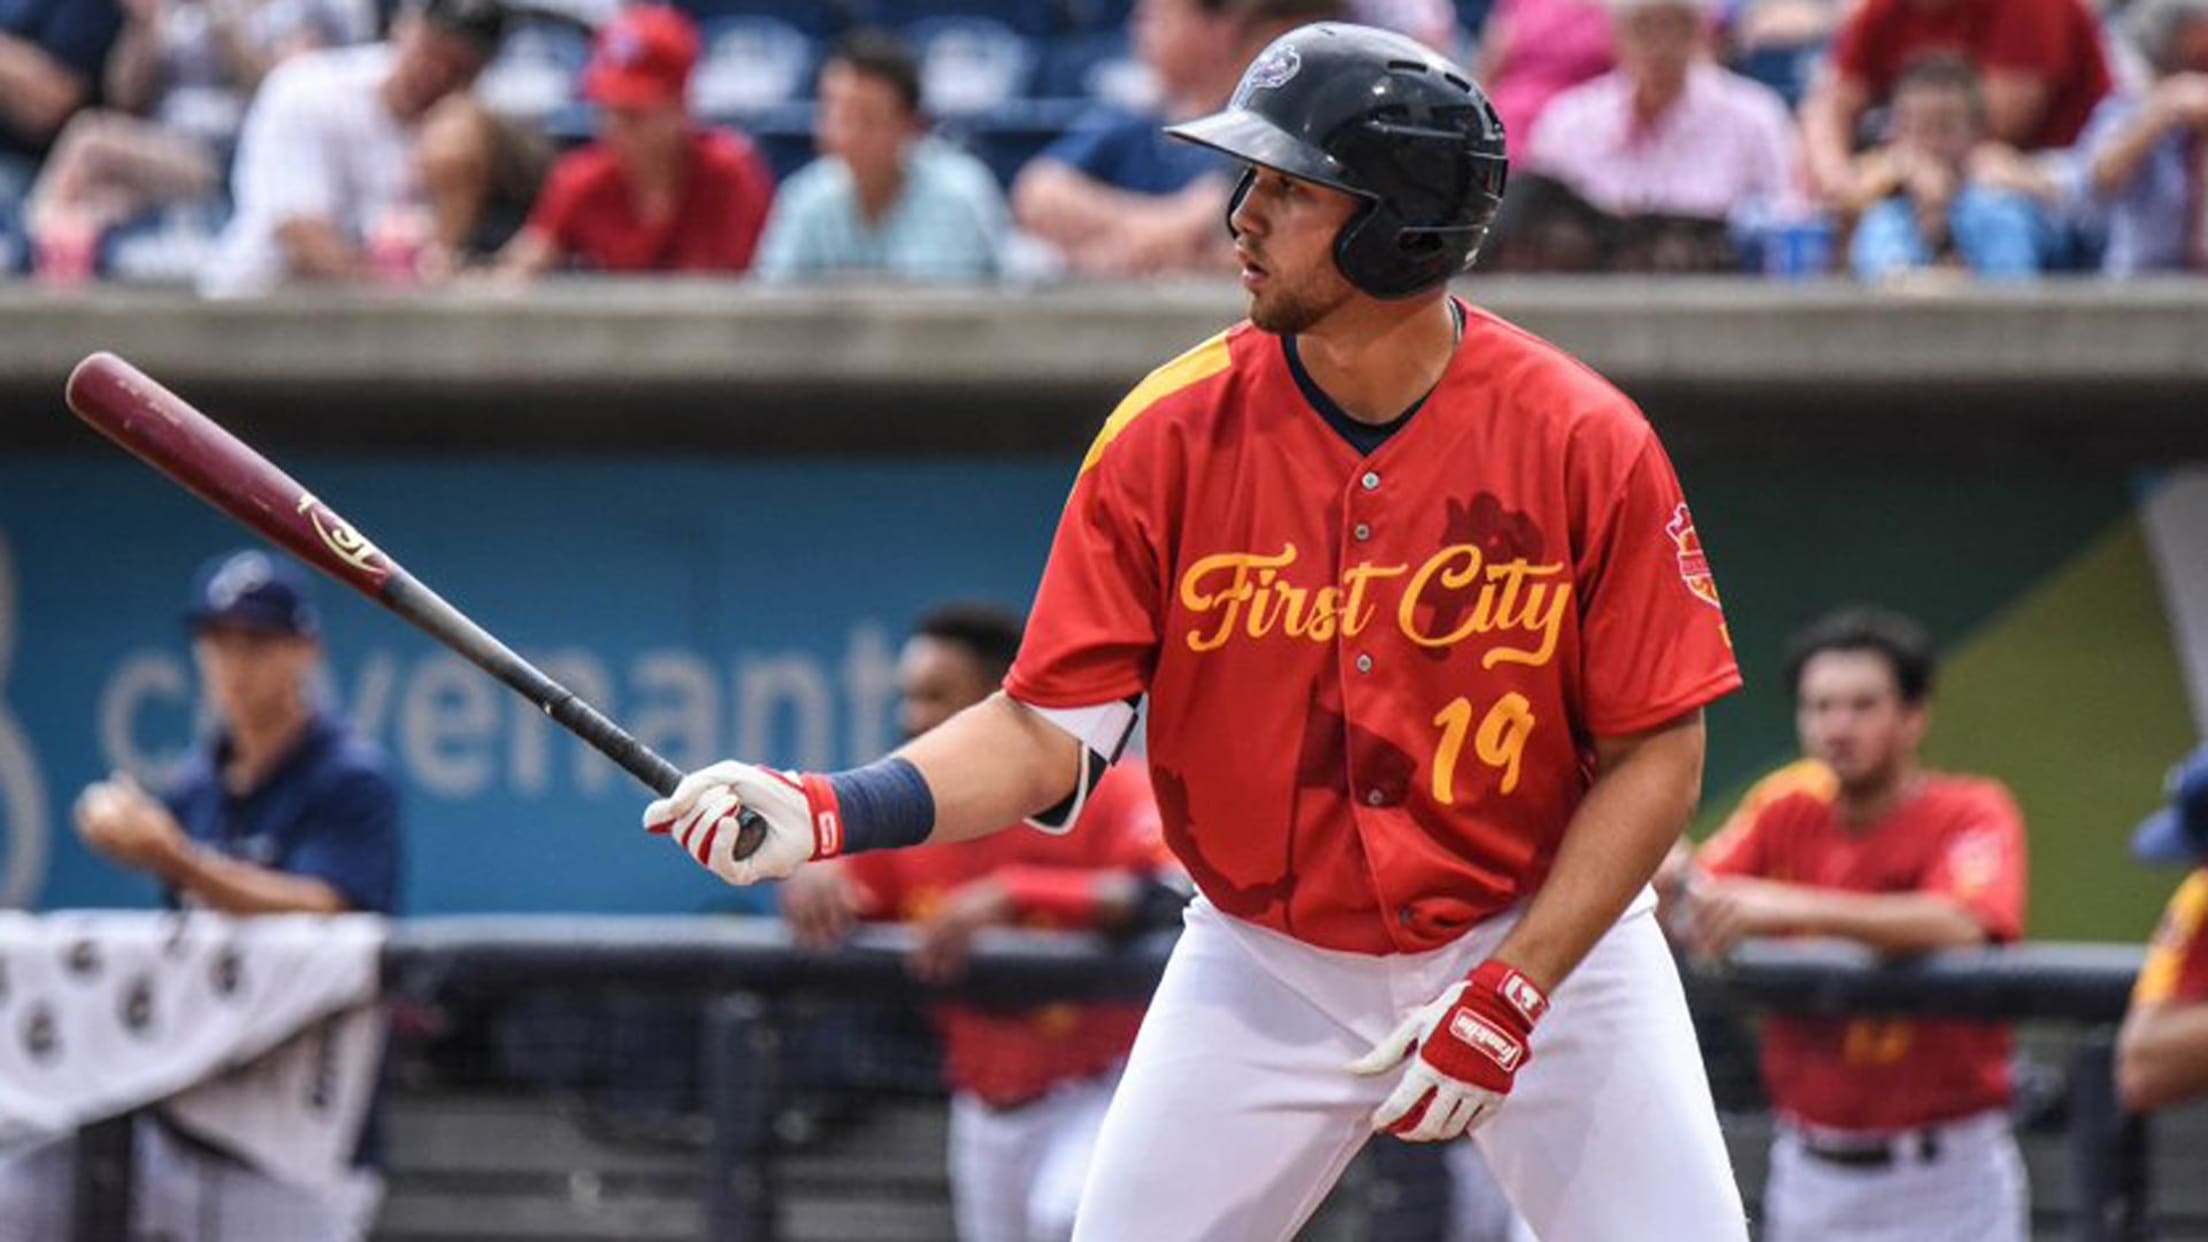
Beginning with a series of "exit interviews" focused on the Twins' key players in 2019 and '20, we take a look back at how the pieces fit together last season and what the future might hold for some of those players.
Visualizations
More coming soon! I'm currently in the process of refreshing my D3.js knowledge.
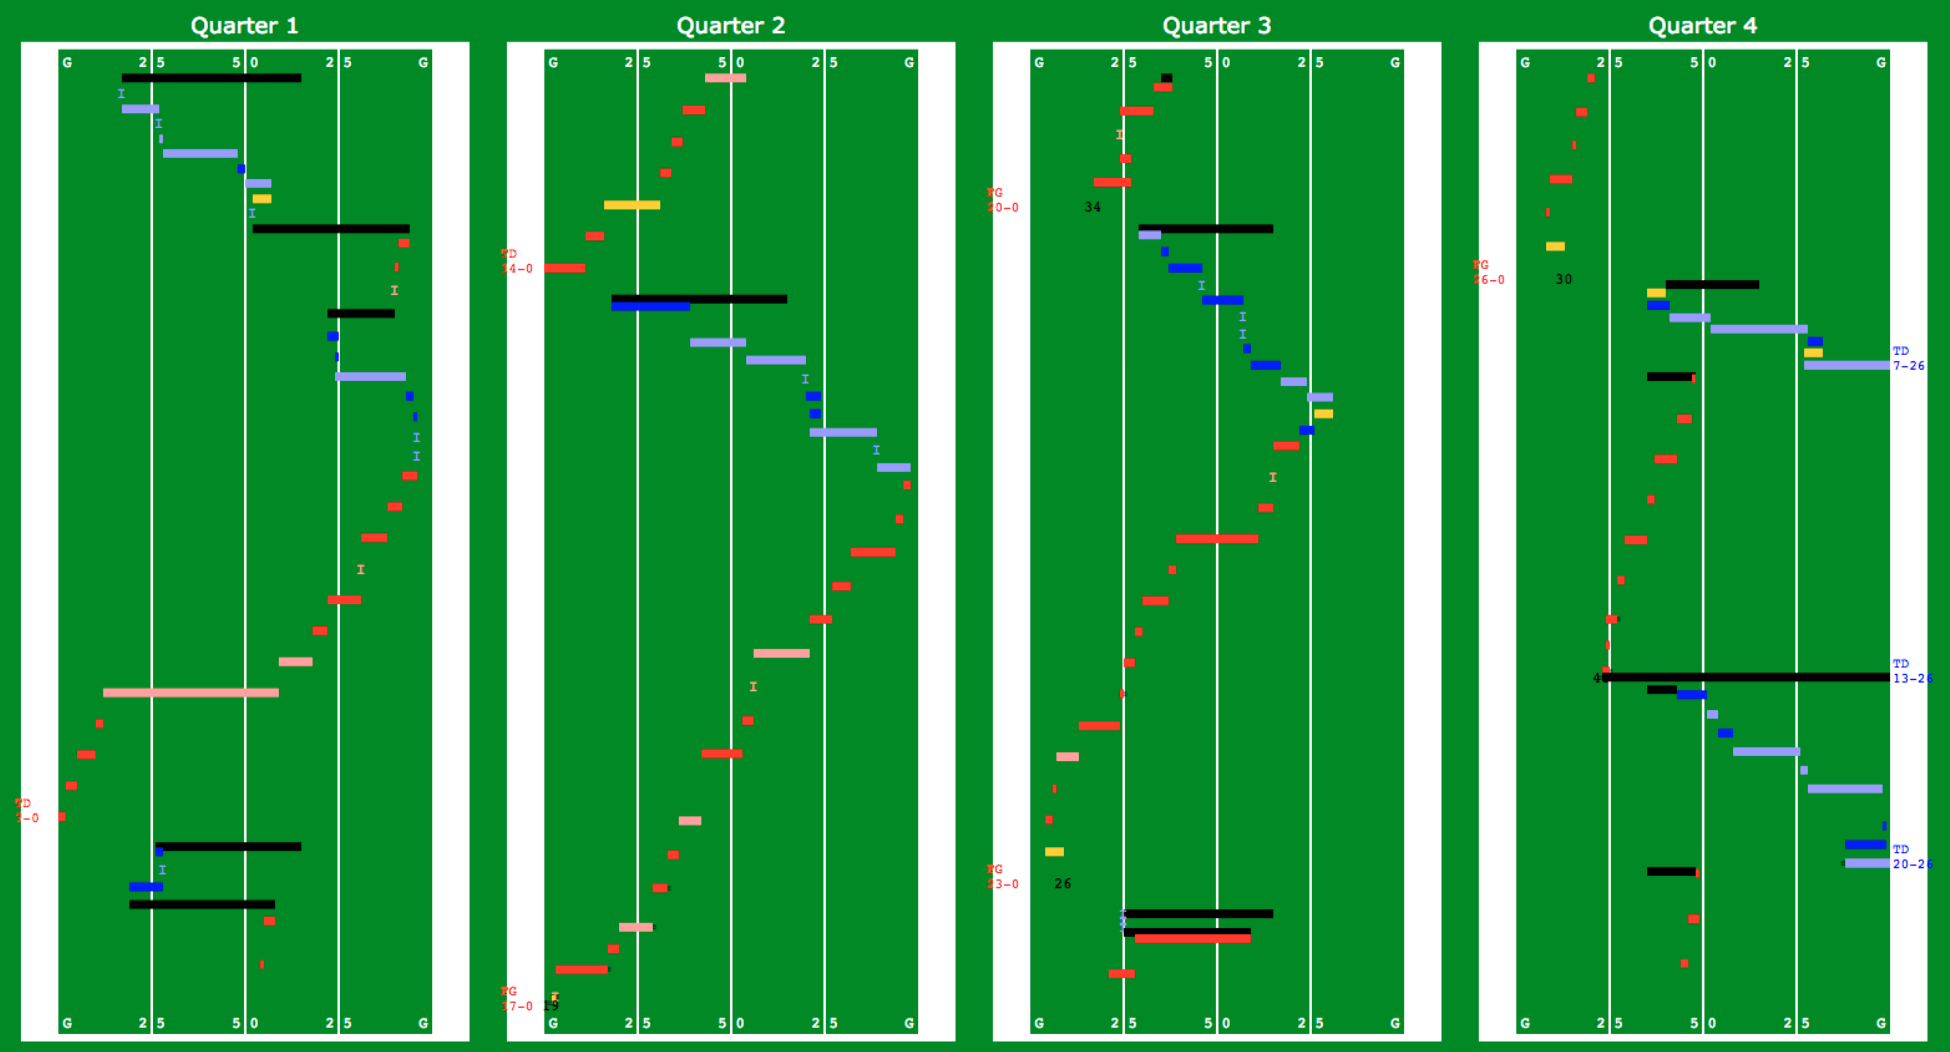
Read Option: Visualizing Football Play-By-Play Data
Traditional football boxscores make it difficult to quickly understand important elements like the pace of a game and the distribution of runs, passes and special teams plays that illustrate the teams' strategies and how they change over the course of a game. This visualization addresses those issues in its depiction of play-by-play data from the 2013 NCAA Division 1 FBS college football season.